
OnPage Enterprise (Dispatcher) Console Dashboard Overview
Use the OnPage dispatcher console dashboard to monitor messaging activity, user availability, and on-call coverage from a single, centralized view. The dashboard provides real-time metrics, performance analytics, and schedule visibility to help dispatchers manage communications efficiently.
Step 1: Access the Dispatcher Console Dashboard
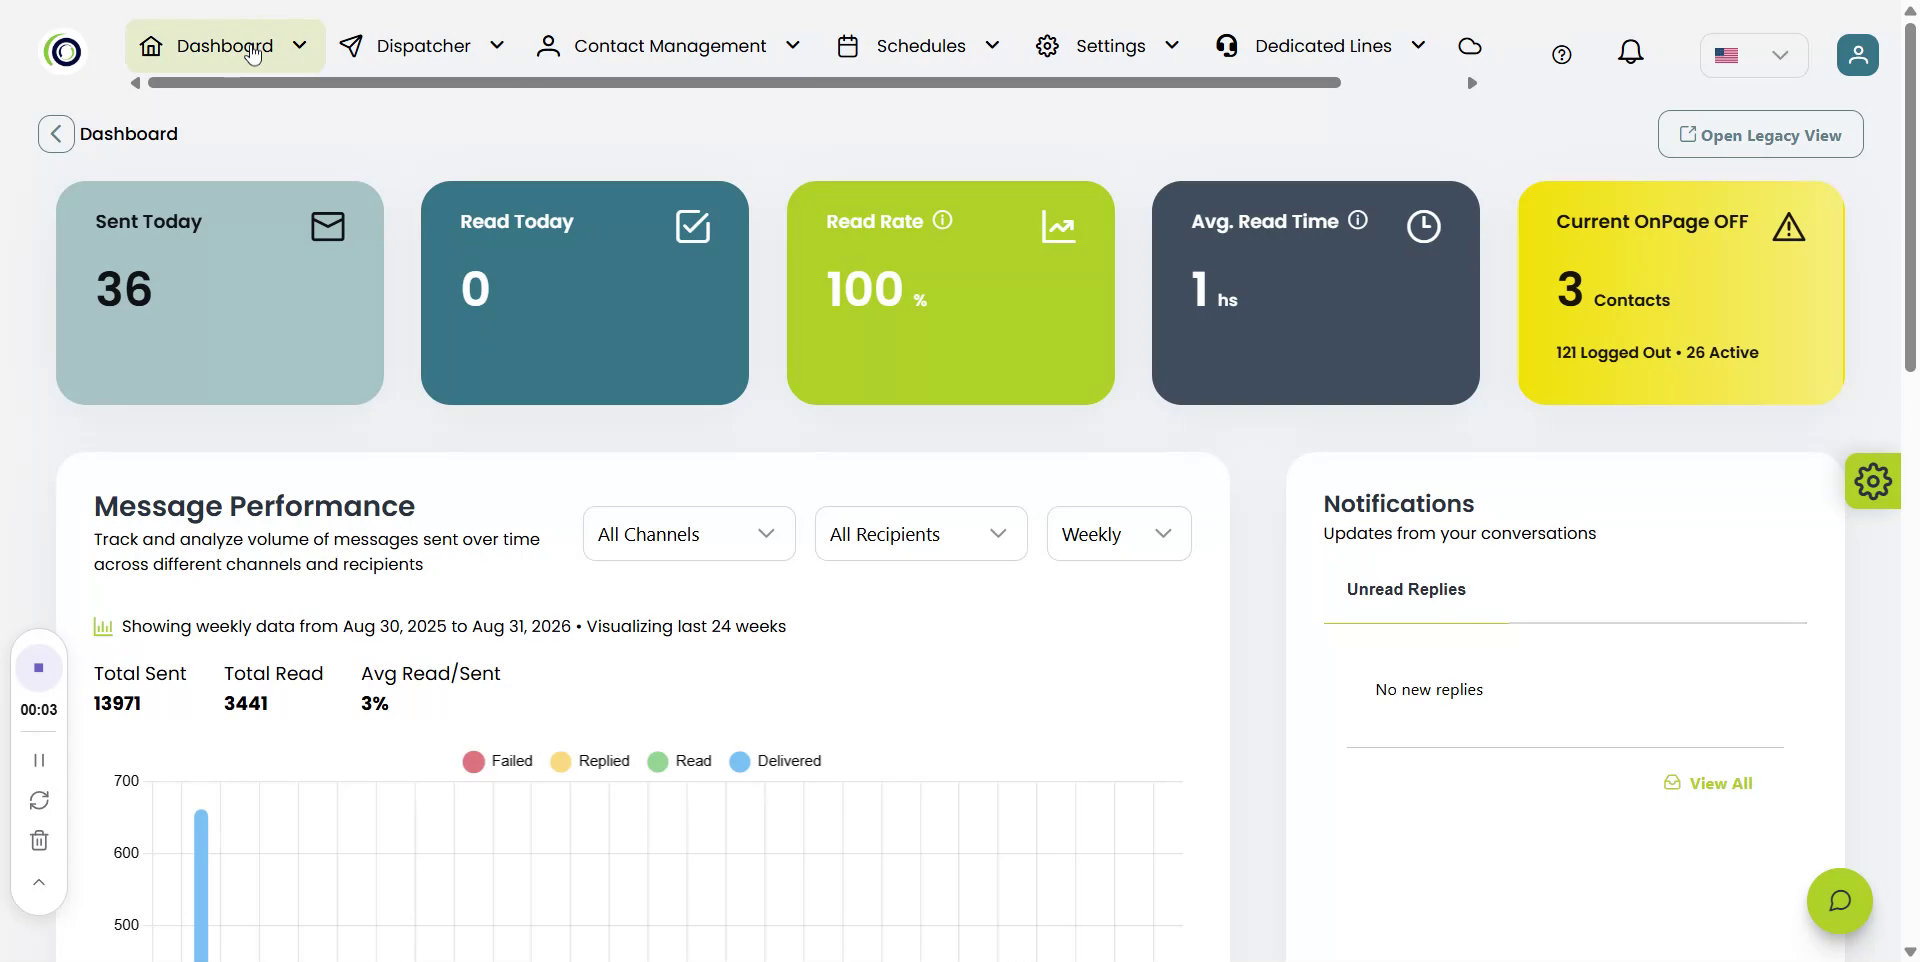
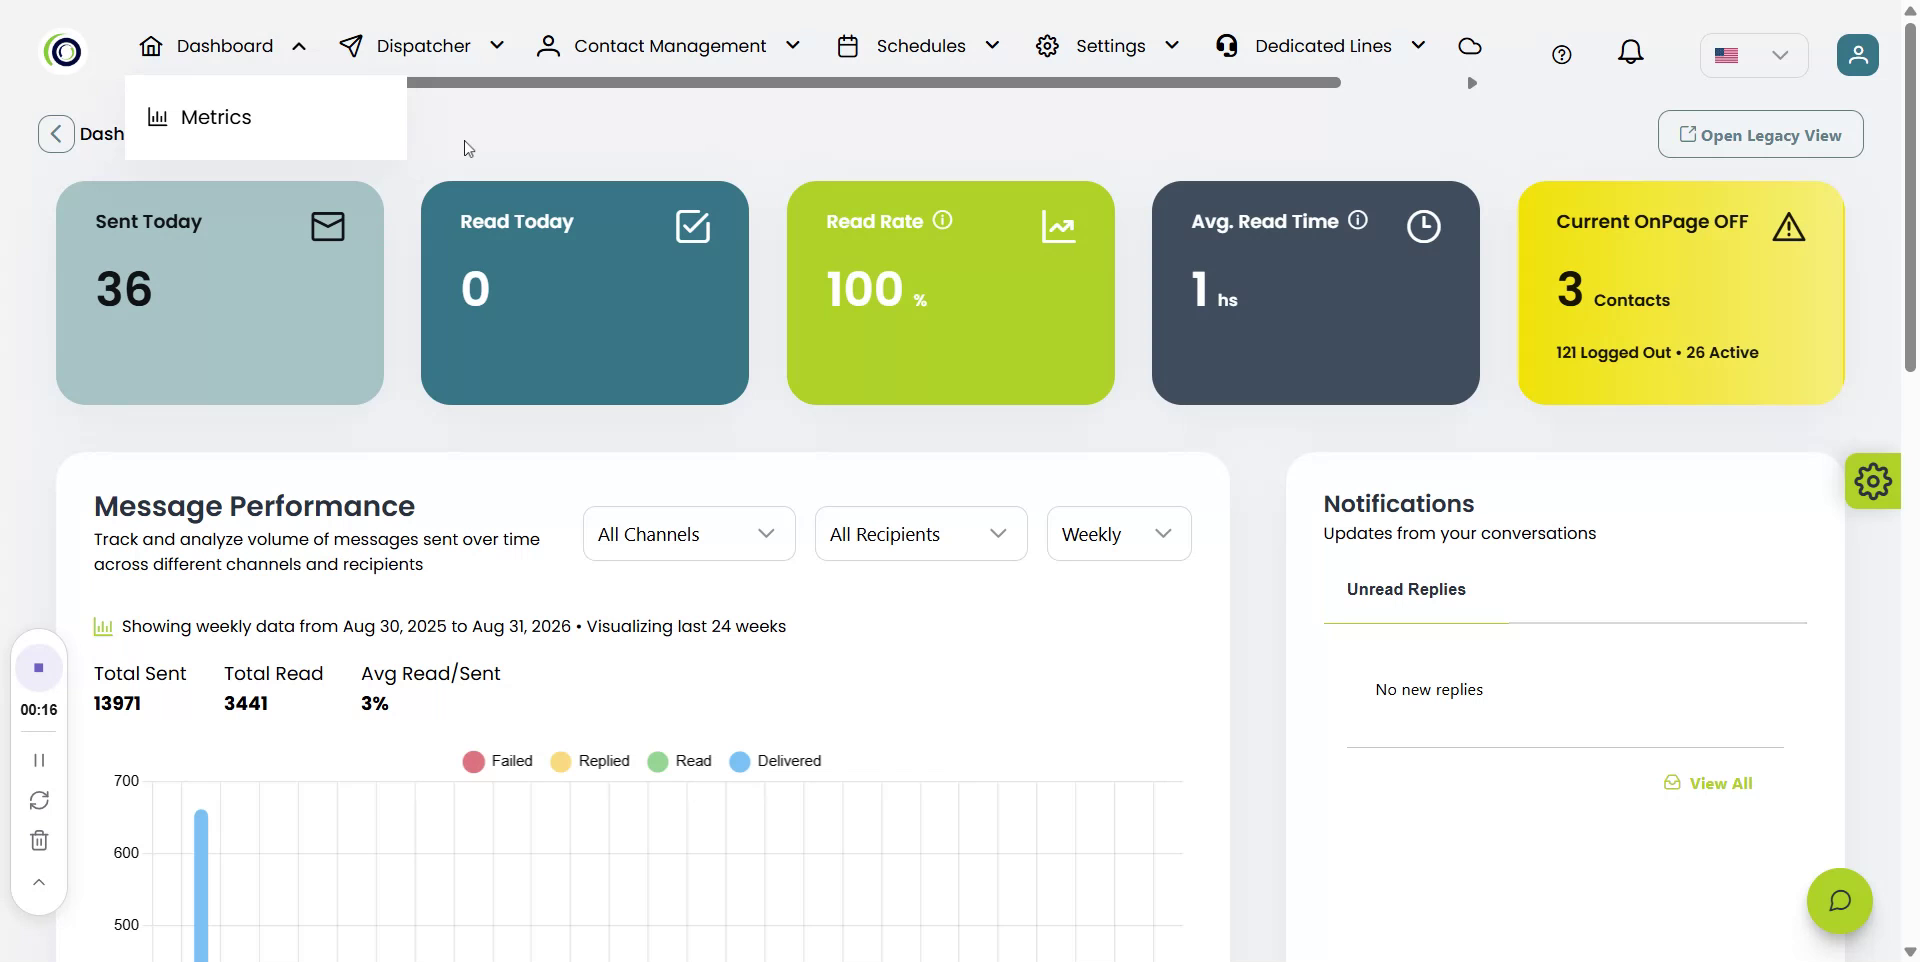
Welcome to the OnPage dispatcher console. Open the dispatcher console to view the main dashboard, which serves as the central hub for your organization’s messaging activity and performance insights. The dashboard provides a consolidated view of messaging activity, performance, on-call status, and upcoming schedules.
Step 2: Review Key Messaging Metrics
At the top of the dashboard, review the key messaging metrics, including:
-
Sent Today
-
Read Today
-
Average Read Time
These metrics offer a quick snapshot of overall message activity and how quickly messages are being acknowledged.
Step 3: Monitor Pager-Off Users
Locate the “Current Pager Off” card to see which users currently have OnPage turned off. This helps you quickly identify users who may not be available to receive OnPage messages and adjust your dispatching decisions accordingly.
Step 4: Analyze Message Performance Over Time
In the Message Performance section, review the visual overview of message activity over time. You can track message volume and status, including:
-
Read
-
Delivered
-
Replied
-
Failed
Use these insights to understand engagement and delivery trends across your organization.

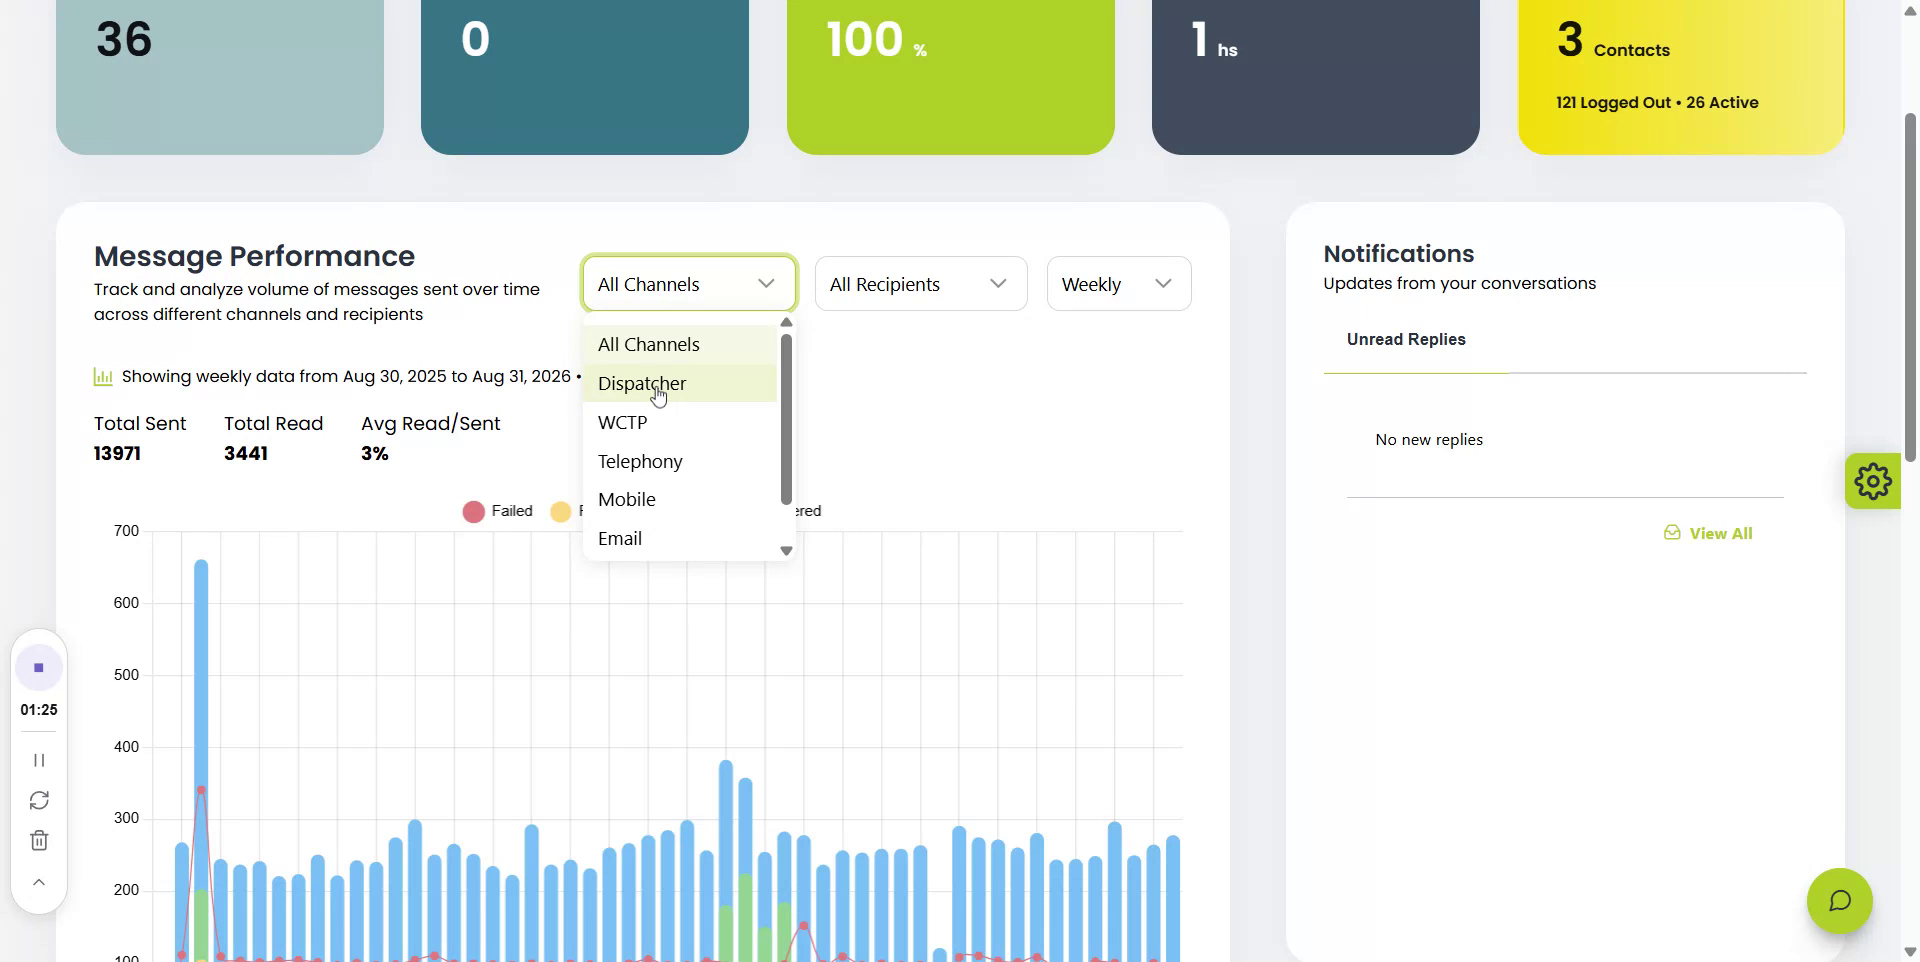
You can use the available filters to analyze activity by channel,
by recipient,
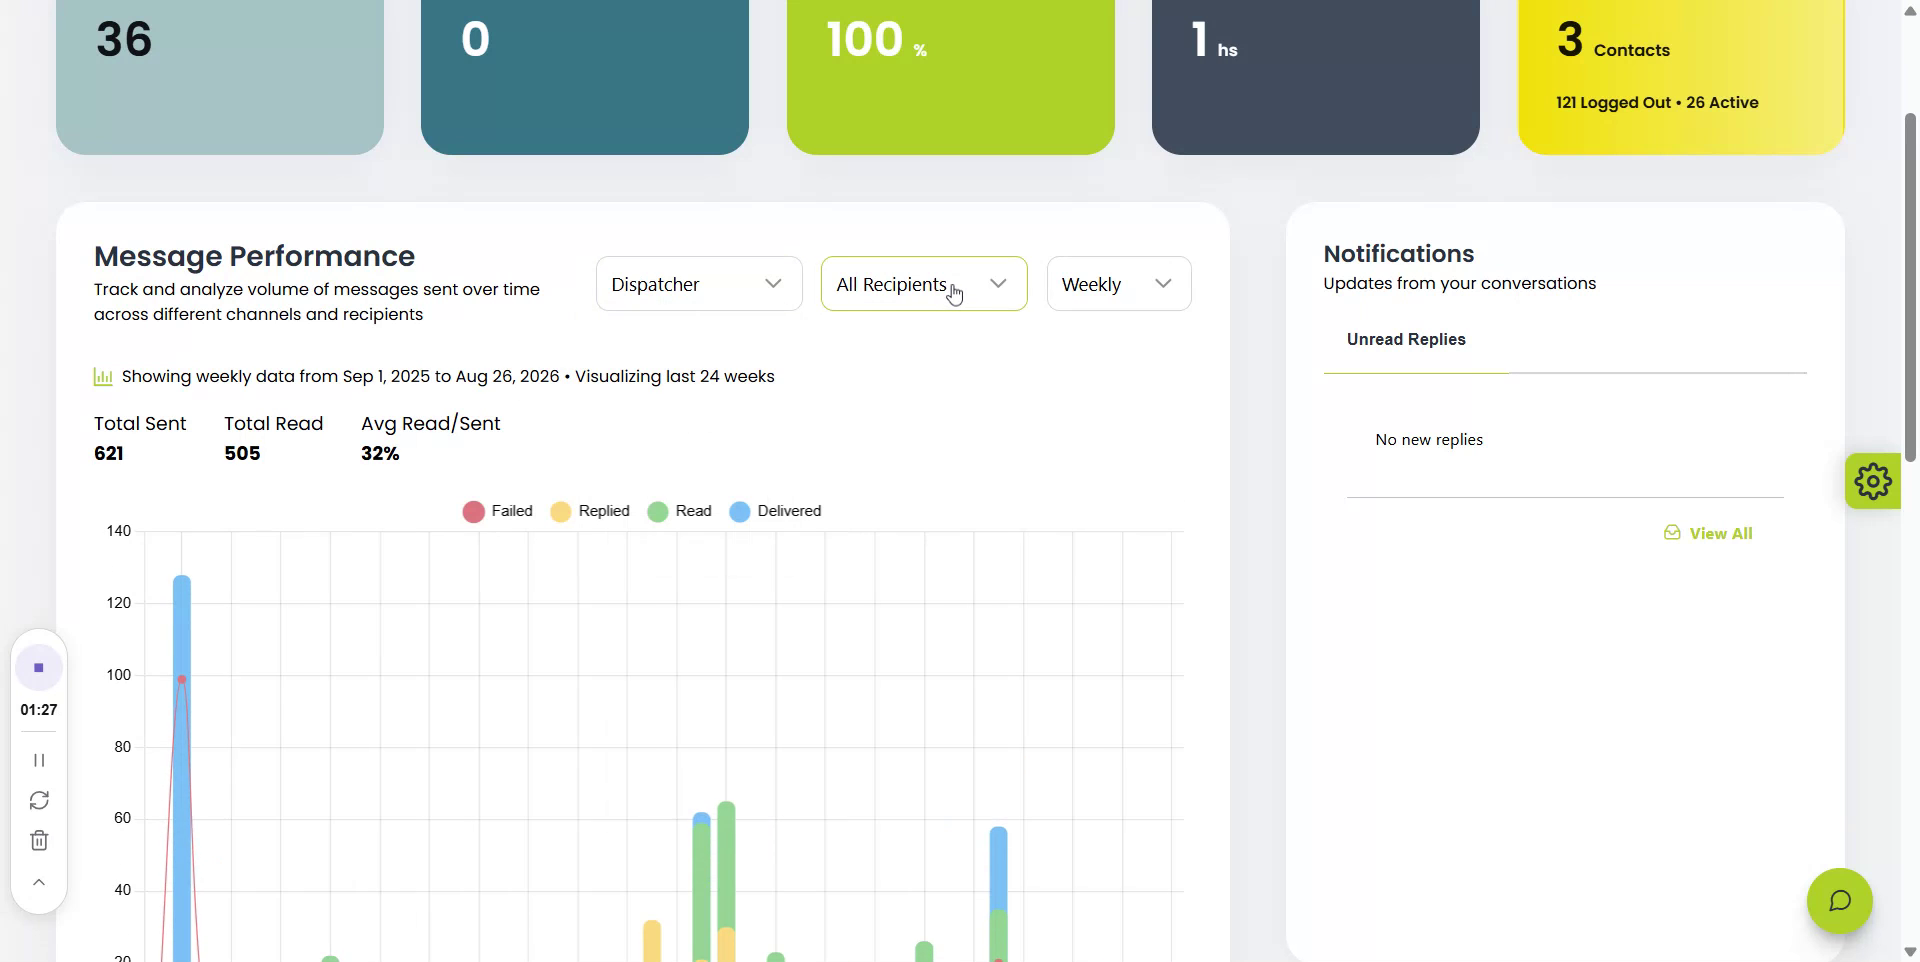
and by time period,
making it easier to review messaging performance and identify trends.
Step 5: Check Notifications for Important Updates
Use the Notifications section to view important updates from your conversations, including unread replies. This allows you to quickly identify activity that may require attention or follow-up.
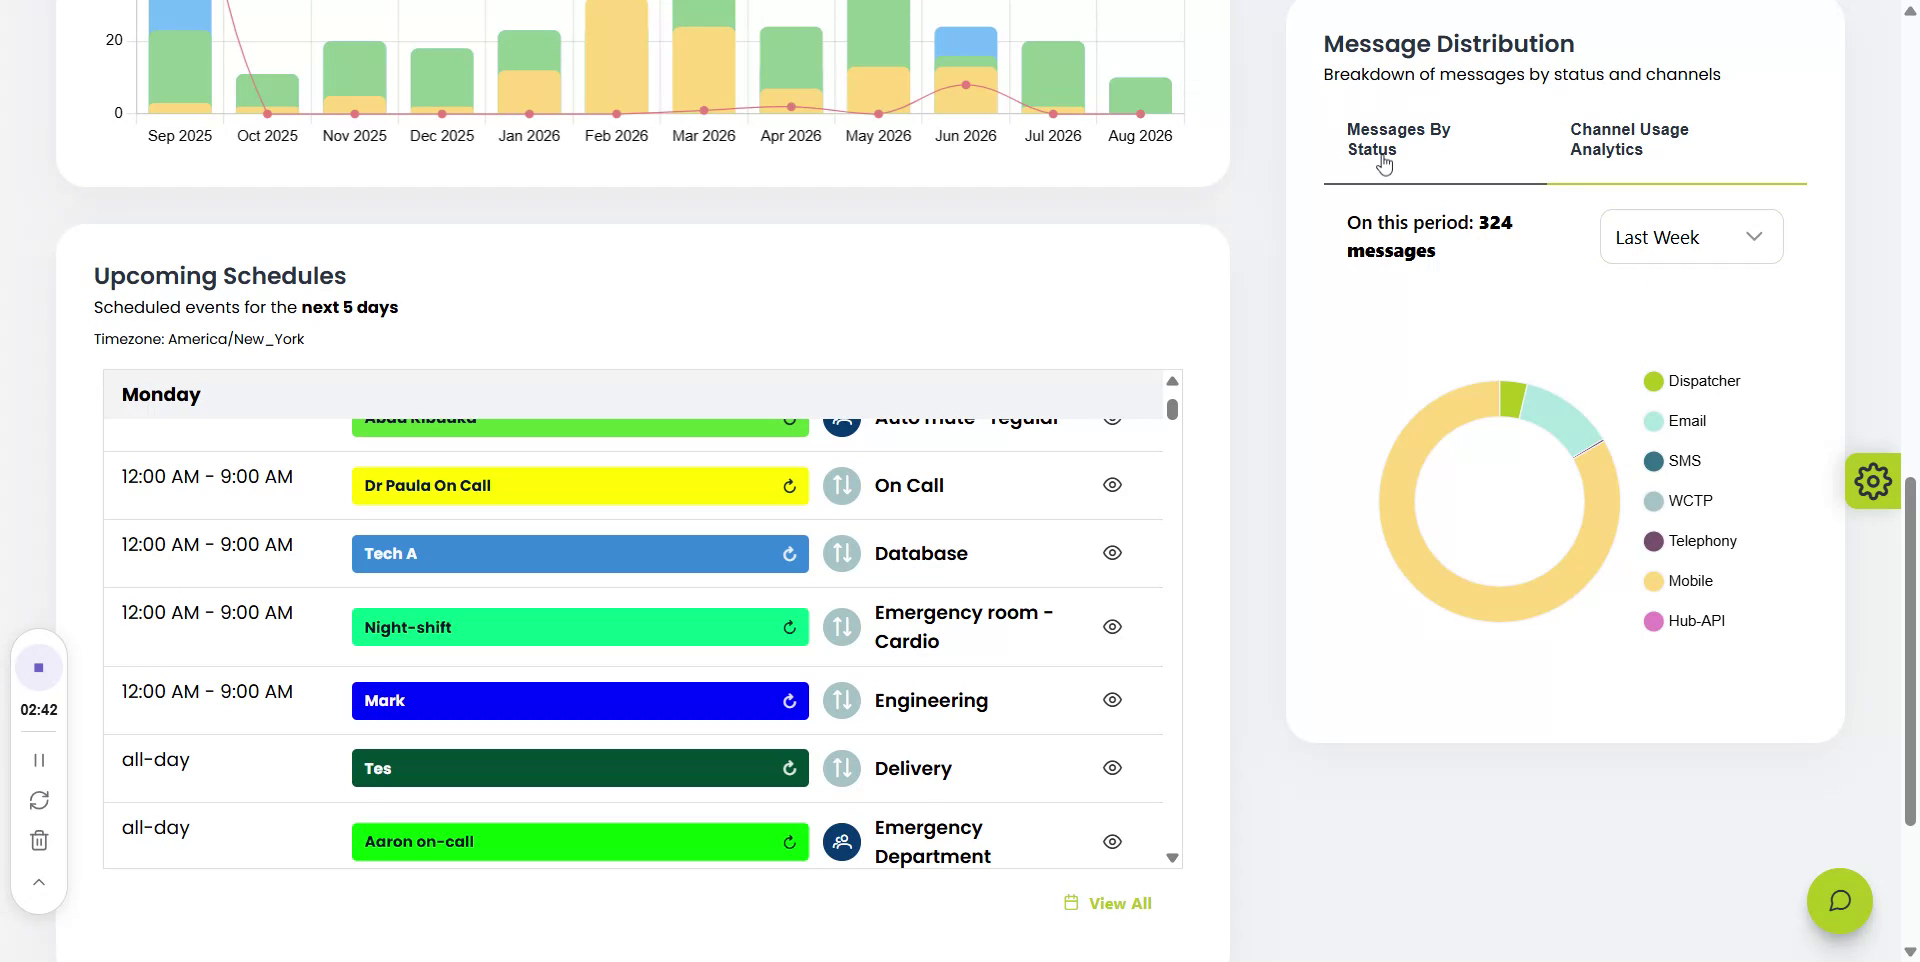
Step 6: Review Upcoming On-Call Schedules
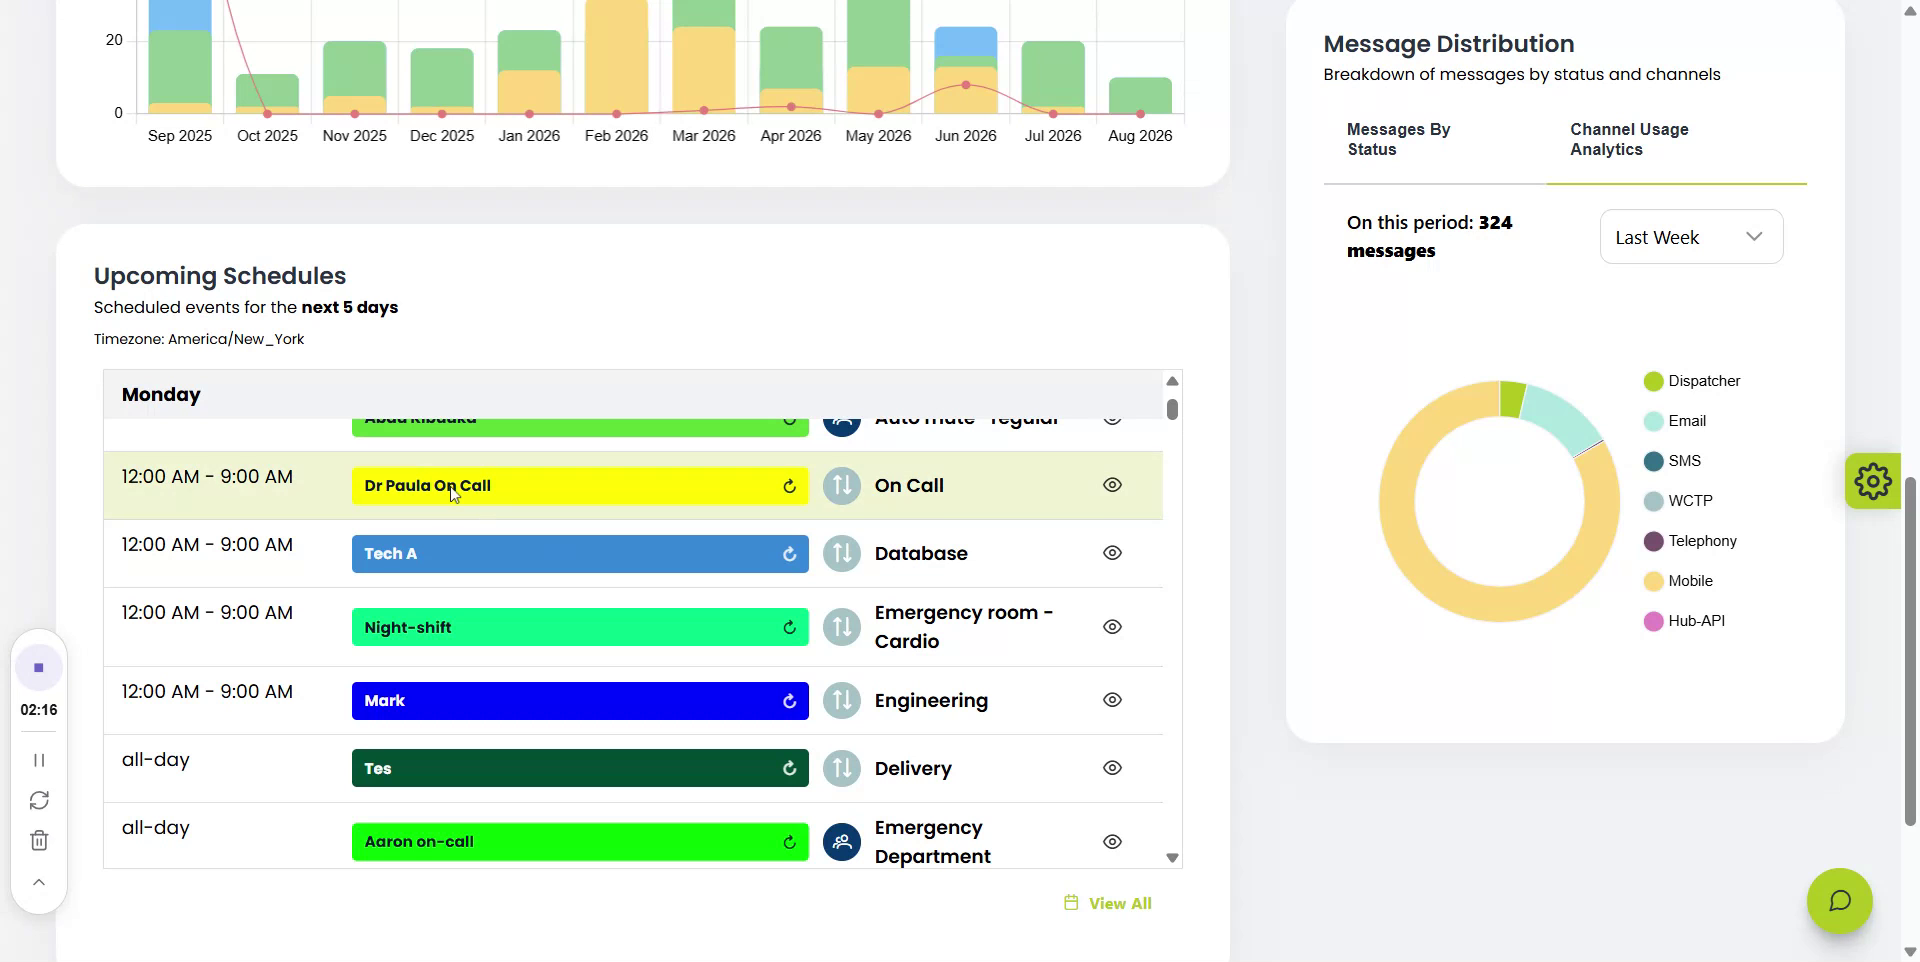
In the Upcoming Schedules section, review visibility into scheduled users for the upcoming days. You can quickly see:
-
Who is scheduled
-
The associated group
-
The scheduled time
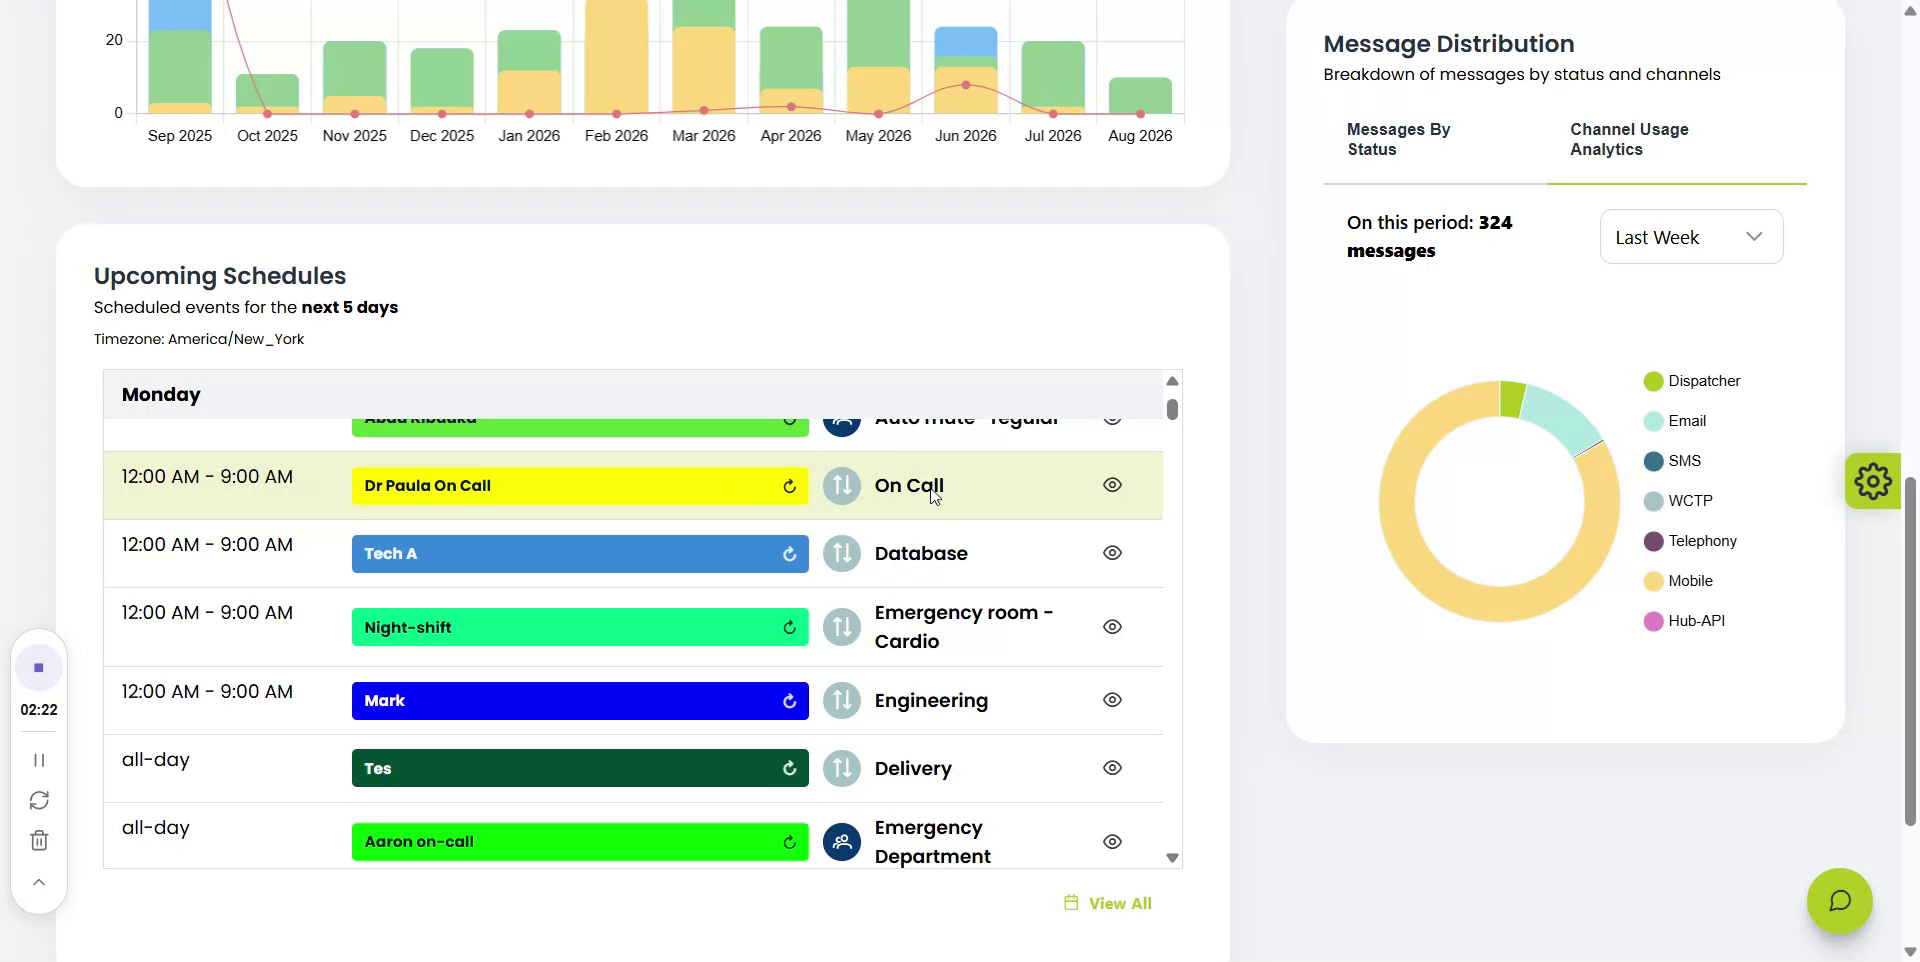
This helps you understand upcoming on-call coverage directly from the dashboard.
Step 7: Examine Message Distribution and Usage
Open the Message Distribution section to view a breakdown of messages by status and by communication channel.
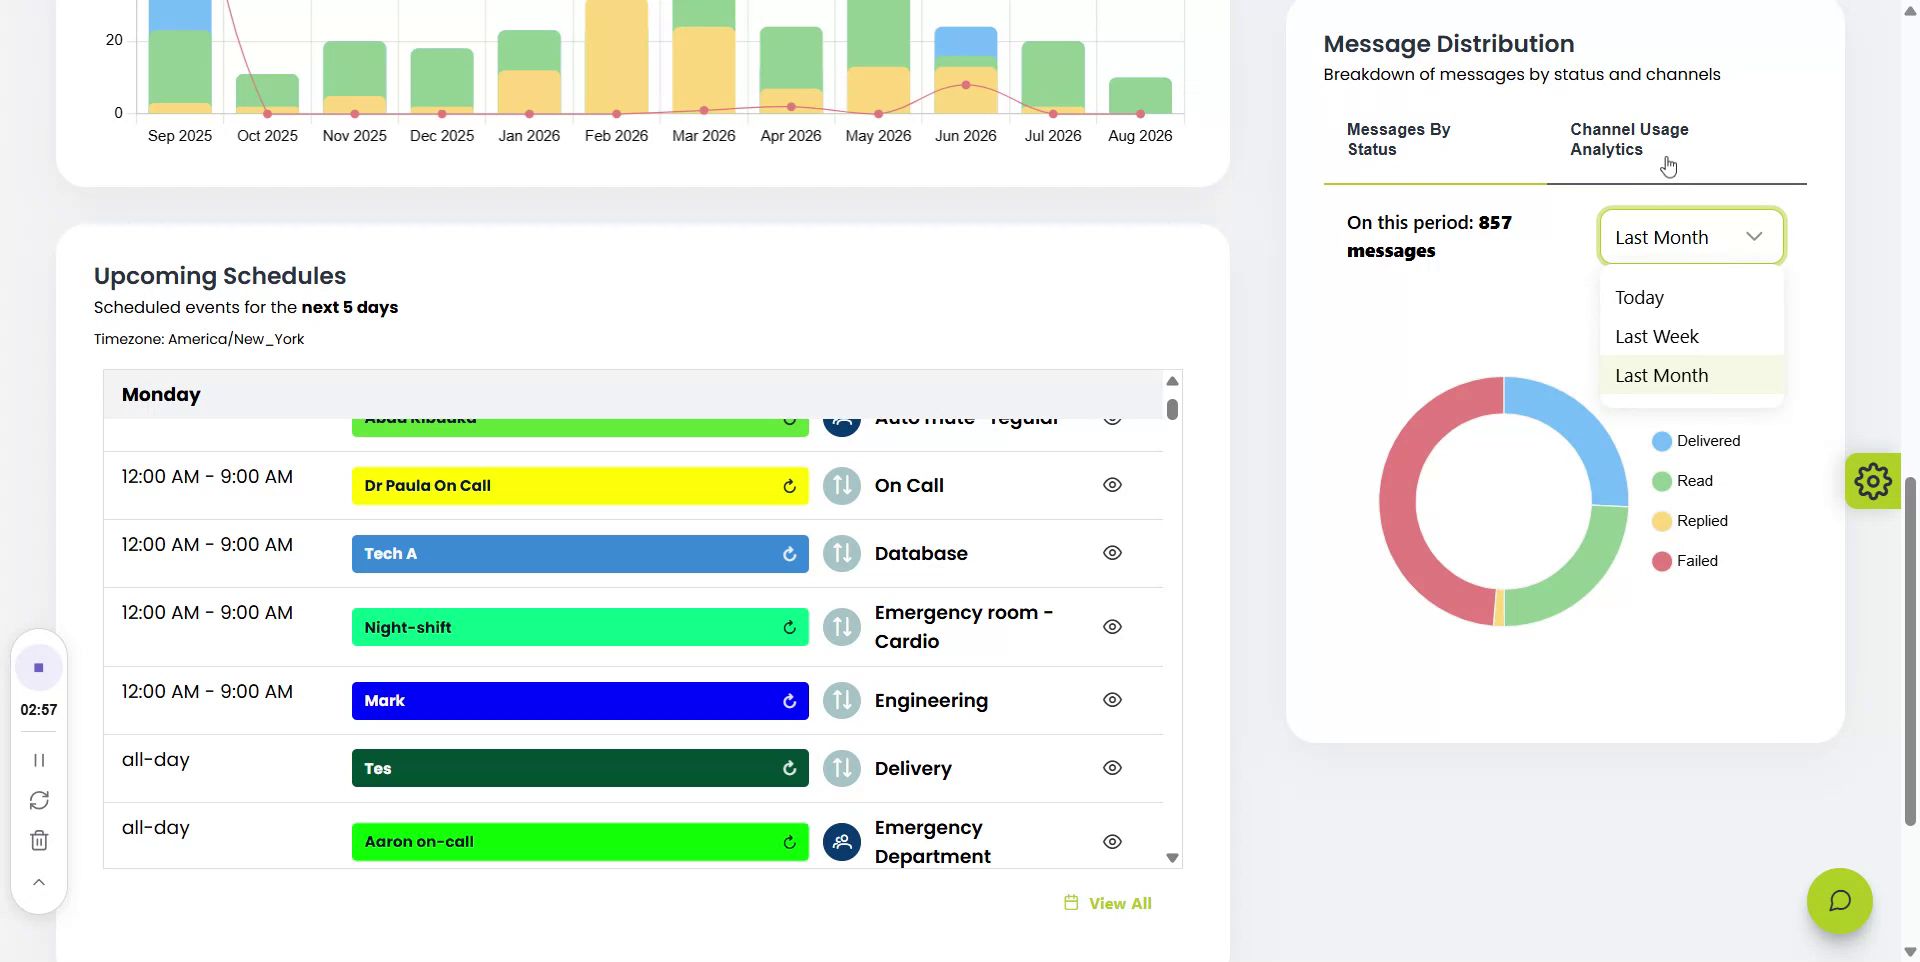
You can switch between Messages By Status and
Channel Usage Analytics views,
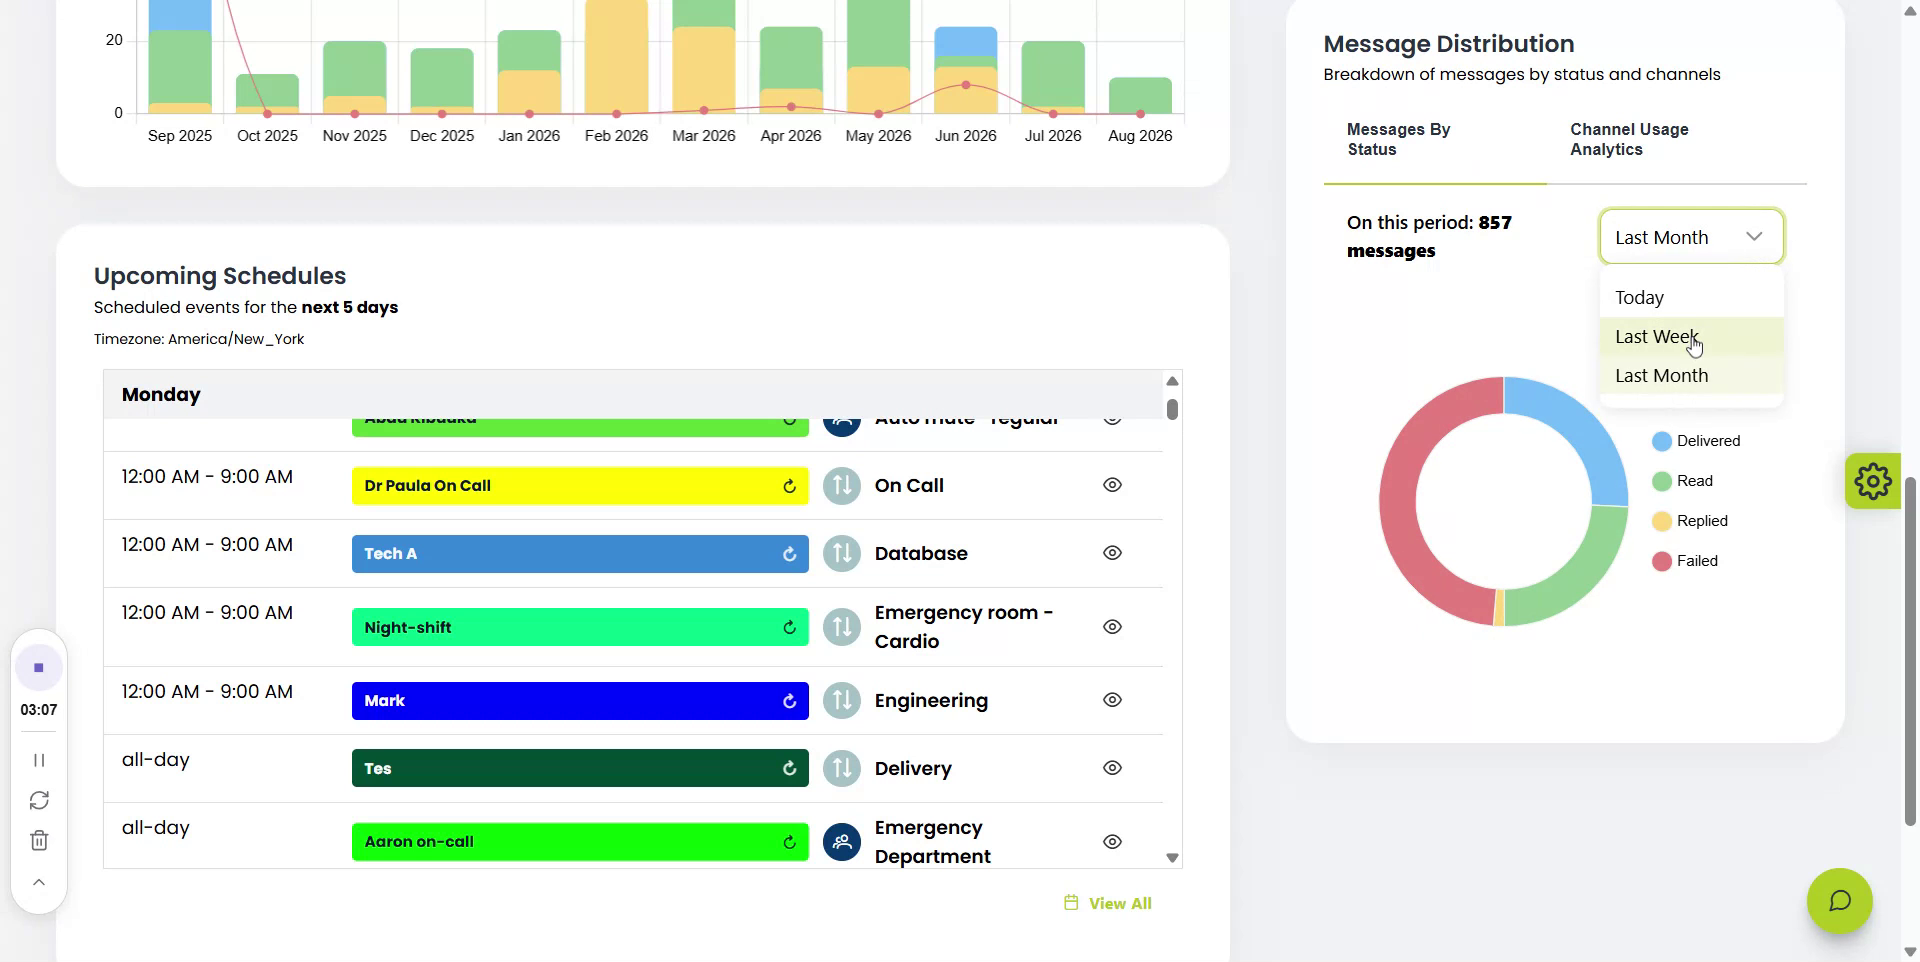
and select a time period to better understand how messages are being distributed across your organization.
Step 8: Use the Dashboard for Ongoing Monitoring
Use all dashboard components together—key metrics, pager-off users, message performance, notifications, upcoming schedules, and message distribution—to maintain a comprehensive, real-time view of message activity, user availability, and coverage from one location.